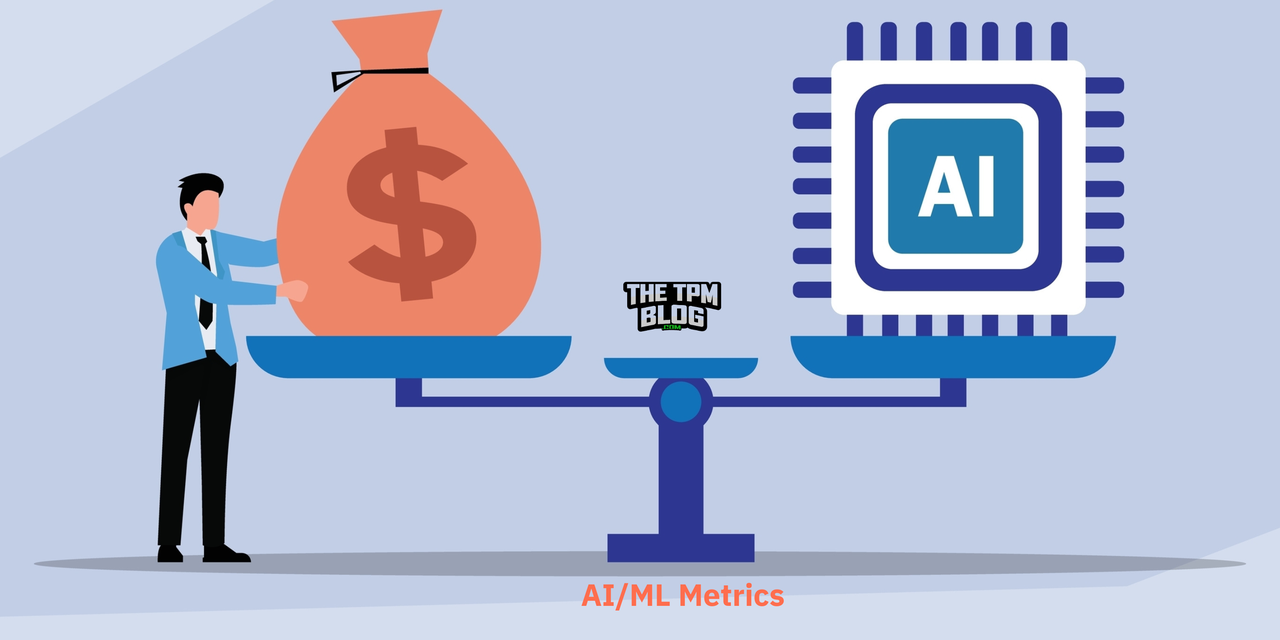
With the current push to adopt AI, leaders sign off on initiatives without knowing how to judge whether the models are effective or are worth the investment. As a TPM or manager, if your teams are building or deploying AI solutions, you need to have the relevant AI metrics in your Monthly Business Review. They will give you a data-driven perspective to evaluate performance, control costs, and keep outcomes aligned with business goals. Metrics also help align teams across multiple disciplines like science, engineering, product, programs and finance. Managers lead by example by understanding these metrics and asking insightful questions.
This guide breaks down the fundamentals both managers and TPMs need to oversee AI initiatives with confidence and adds the considerations most leaders miss when making strategic decisions.
Core AI/ML Metrics
Consider the golden triangle in software development of balancing quality, scope and delivery where changing one aspect can impact the rest. On a similar vein, I consider AI/ML metrics in terms of 3 broad categories – Performance, Operational Metrics, and Cost. Optimizing for any of these will likely impact the others. It is a balance you need to strike based on your goal.
These metrics help my teams understand how I think and it keeps everyone aligned on a data driven mindset. Your metrics will need to align to your use-case and business goals, but my recommendation is that you should consider these as your base metrics. The prioritization (optimization) of metrics will be driven by the use-case. This is how I approach each of these categories at a high-level:
AI/ML Performance metrics
Performance metrics show whether a model is truly solving the problem it was designed for. Leaders need to know which metric (accuracy, precision, recall, F1 score, ROC-AUC, and loss) matters for their use case and why. Each metric highlights different risks and trade-offs. Choosing the wrong one means you could be reporting success while the model quietly fails in production.
AI/ML Operational Metrics
Operational metrics tell you if a model that works in the lab can survive in production. Latency, throughput, drift, and retraining frequency highlight whether predictions are timely, scalable, and reliable as data evolves. For leaders, these metrics impact customer experience and resilience. A model that has good performance, but is slow, brittle, or outdated still fails the business.
AI/ML Cost Metrics
Cost metrics ground AI in reality: compute, storage, maintenance, and scalability costs can spiral quickly, while resourcing costs to build, deploy and maintain these solutions should also be considered in the overall spend. ROI should be the guardrail to ensure the spend is justified. If costs climb without matching business value, your AI strategy risks becoming an expensive science experiment.
This article assumes that you have an AI/M system deployed in production using a model/AI backend for inference.
After reading the article, if you are subscribed to the free monthly newsletter, the next edition includes free resources: ‘AI/ML Metrics for Managers’ and an ‘AI/ML Metrics Cheatsheet for Managers & TPMs‘ pdf which serve as a handy reference for the content in this post and includes questions to ask when overseeing AI/ML programs. All content on this blog is relevant to software development managers/ directors, technical program managers, product managers and senior technical leaders.
AI/ML Performance Metrics
Different problems require different ways to measure success. Relying on a single metric like accuracy often gives you an incomplete picture, especially in the case of AI/ML solutions. Depending on your use case, you will need to pick the correct metric as your north star. The performance metric tells you how good your solution is at solving your use-case.
This step assumes you have previously established a clear goal for your AI/ML solution. Read the related blog article ‘AI for TPMs and SDMs’ on how to define your AI/ML goal to hone your approach.
Key metrics:
Accuracy: Overall correctness of predictions. Good for balanced datasets.
Example: In predicting whether an email is spam, 95% accuracy sounds impressive. But if only 5% of emails are spam, the model could simply classify every email as “not spam” and still hit 95% accuracy without actually being any good. This metric usually works when the dataset is balanced but can be misleading when one outcome is far more frequent than the others.
- Formula: Correct predictions ÷ Total predictions
- Optimization: Higher is better
Precision: Of all the predicted positives, how many were truly positive?
Example: A bank using ML to flag fraudulent transactions wants high precision(TP : True Positives) instead of FP(False Positives) so that customers aren’t falsely accused of fraud. High precision in this case is important for customer trust and positive experience.
- Formula: TP ÷ (TP + FP)
- Optimization: Higher is better
Recall: Of all the actual positives, how many were correctly identified?
Example: In cancer screening, recall matters most. Missing true positive (getting a FN: False Negative) cases can be catastrophic. In these cases, you are risk averse as the decision can have high impact consequences.
- Formula: TP ÷ (TP + FN)
- Optimization: Higher is better
F1 Score: The balance of precision and recall. Useful when neither can be compromised. It is also called F-measure (or F-score) and gives equal weight to both precision and recall.
- Formula: 2 × (Precision × Recall) ÷ (Precision + Recall)
- Optimization: Higher is better
ROC-AUC (Receiver Operating Characteristic – Area Under the Curve): Shows the model’s ability to separate classes across thresholds. This is helpful when you want to understand overall discriminatory power of the model. ROC is a curve that plots the True Positive Rate (Recall) against the False Positive Rate at different classification thresholds. AUC is the Area Under the Curve, which summarizes how well the model can distinguish between classes. AUC of 0.5 means random guessing, and 1.0 means perfect separation. This is a go-to metric for binary classification problems.
- Formula: Generate ROC graph and measure AUC
- Optimization: Higher is better
Loss Function: This function measures the difference between predictions and actual results. Behind the scenes, every ML model is trained to minimize the loss function. Monitoring the loss on both training data and validation data helps you see whether the model is actually learning or simply memorizing the training set (a problem known as overfitting). This shows how stable and generalizable a model’s results are across new, unseen data. It will show the gap between predicted and actual outcomes. Choose the loss function suited to your model.
- Formula: Cross-entropy loss is common for classification tasks.
- Formula: Mean squared error is standard for regression problems.
Optimization: Lower is better
Other factors that technical managers need to consider as they will affect all the above performance metrics:
Bias
Bias is a risk to all the above metrics and is also a reputational and regulatory risk. Models trained on skewed or incomplete data can produce unfair or discriminatory outcomes.
Bias can creep in through:
- Data collection (e.g., underrepresenting certain groups)
- Labeling (e.g., subjective human judgment)
- Model training (e.g., reinforcing existing patterns of inequality)
Managers need to ensure their teams have processes in place to detect and mitigate bias. This includes auditing training data, applying fairness metrics, and stress-testing models before deployment.
Explainability
As models get more complex(deep learning ,convolutional neural networks, LLMs), it becomes harder to explain how they reach a decision. For sectors like finance, healthcare, or law, which are heavily regulated, explaining how a conclusion was reached is a requirement. GDPR in Europe requires explainability and data minimization, HIPAA in the U.S. governs healthcare data and the EU AI Act introduces new compliance requirements.
Tools like SHAP and LIME make models more interpretable by showing which inputs most influenced the predictions. You will need to consider if your team can explain the model’s decisions in plain language if regulators, customers, or executives demand it. ML projects should ideally have governance baked in, not bolted on. This would mean documented risk assessments, audit trails, decisions made, metrics and reviews where necessary.
Takeaway for leaders: Always ask your team why they chose a metric and whether it aligns with the business outcome you care about.
AI/ML Operational Metrics
Models don’t stay accurate (or perform as initially deployed) forever. Customer behavior, data patterns, or market conditions can change. You will need to track, alert and react to these changes to decide whether to retrain your model, build a new solution or add in other checks. Other AI/ML operational metrics are similar to existing software systems. They remain key to ensuring production performance needs are met (such as latency, response time, throughput, errors etc.) as models can slow down the overall system if not optimized to meet operational expectations. An important point to understand here is that maintenance of a deployed AI solution also needs engineer/ science resources to analyze the logs, perform audits, retrain the model, test and optimize the different parts of the system to maintain the SLA(Service Level Agreement). Many solutions might need additional hardware resources, which adds to the budget.
Key metrics:
Model drift: When real-world data shifts, there is a decline in performance as data changes. For example, a credit card fraud detection model might fail in a few months as scammers adapt their tactics. There needs to be a process/metric in place to monitor model drift by comparing predictions on new data versus your baseline.
- Formula: Compare predictions on new vs baseline
- Optimization: Lower is better
Model Latency: Time taken for the model to return a prediction. This helps you understand where the slowness in a system occurs. For example, if a voice assistant takes 5 seconds to answer instead of 1 minute, then users will drop off. You will need to dive in to understand where the delay is occurring in the data flow to the model or in processing to see how to minimize it to meet your SLA.
- Formula: Compare predictions on new vs baseline
- Optimization: Lower is better
Model Throughput: Number of predictions the model can handle per second/minute. This drives infrastructure optimization decisions for model hosting. For example, if an ad-serving model can’t handle Black Friday traffic spikes, it will slow down the entire shopping website. You will need to add GPUs to power up your model’s capacity to maintain the same SLA.
- Formula: Compare predictions on new vs baseline
- Optimization: Higher is better
Model Retraining Frequency: This determines how often the model is updated with new data on a regular basis. Sometimes this is done only when there is a significant data shift. Leaders should ensure retraining schedules are in place and that these shifts can be detected. Retraining can be carried out and evaluated to see if there is any improvement in model predictions and metrics to inform whether the new model is worth deploying.
- Formula: Compare predictions on new vs baseline
- Optimization: Depends on data volatility
Model Error Analysis: This is the distribution of errors across categories, by tracking false negatives/ false positives and misclassified cases. For example, an AI resume checker tool consistently misclassifies qualified resumes as “low fit,” exposing a systematic false negative problem, which is only identified when audited.
- Formula: Compare predictions on new vs baseline
- Optimization: Lower is better
User Feedback/Override Rate: If applicable in your system or if you have human-in-the-loop processes, you can track how often humans correct, disagree or override predictions from the model to inform you on the performance of your model and if your model metrics have alerted you to this earlier. For example, human customer service agents override an AI chatbot’s suggested responses 40% of the time, which signals poor model alignment with real-world conversations. This points to an issue with the established goal or model performance metrics.
- Formula: Compare predictions on new vs baseline
- Optimization: Lower is better
Takeaway for leaders: Include the relevant AI/ML specific operational metrics in a monthly dashboard or as an addendum to your Monthly Business Review(MBR) and ensure all your managers / teams understand and react to these metrics.
AI/ML Cost Metrics
ML models can be expensive to train and run. Leaders must connect performance to business value. Most of these are available through your cloud provider platform’s billing reports. Managers need to review these on a monthly basis(or more frequently) to mitigate any unplanned costs or to re-evaluate the ROI.
At Amazon, every internal team gets a monthly bill from AWS that breaks down our costs by service used. It was critical for me as a senior manager to see deviations, and for the front line managers to dive into to ensure they had a handle on their spend. It helped us catch and switch off test AWS Sagemaker instances which were racking up costs.
On a business level, if a retailer uses ML for personalized recommendations and the model costs $200K annually in compute and staff time. If it drives a $10M lift in sales, the ROI is clear. However, an AI-powered chatbot that reduces support tickets by 1% but costs $1M to maintain versus the lower cost of using a human team of customer representatives, then it may not justify the spend. For all costs, lower is better, while ROI should be higher than costs.
Key metrics:
- Compute costs: Cost of training and hosting/running the model in production.
- Storage Costs: Data and model storage expenses.
- Maintenance Costs:This comprises engineering hours and monitoring tools costs. This should include the resources needed to maintain, monitor, update the AI/ML solution as this becomes part of your operational overhead (or KTLO- Keep the Lights On).
- ROI (Return On Investment): This is the net business value compared to total ML spend. This is key to ensuring the solution is still financially viable for your goal. This is a key high level metric which can trigger you to dive deeper into all metrics above to understand the ROI levers.
Other factors managers should consider:
- Scalability Costs: This is the additional cost as model usage grows. This is a forecast based on throughput demand and informs you when the ROI will change or if scaling is not feasible for your real-world use case.
- Build vs Buy: Not every ML project should be built in-house. The value of alternative approaches (manual or vendor solutions) should be considered to move fast and learn quickly. Usually you build when your problem is highly customized/unique.You should lean towards Buy when your problem is commoditized(eg: language translation, transcription, sentiment analysis etc.). Understand the propo
- Collaboration: ML projects fail when data scientists, engineers, and business stakeholders don’t speak the same language. Hitting 90% model accuracy may be quick, but reaching 95% can take months or be unattainable. To reduce friction, push for clear documentation of goals, assumptions and risks. Ensure that there are cross-functional reviews of model design, project phases, metrics and outcomes. AI projects are inherently unpredictable as many times the model can be a black box.
Takeaway for leaders: Treat cost as a first-class metric alongside performance and operations. Always connect spend to business outcomes, and push your teams to show ROI, not just technical progress. If costs rise while impact stays flat, that’s a signal to pivot, simplify, or stop.
Hypothetical example of costs:
Below is an example of running for one month with a SageMaker‑hosted model. Numbers are illustrative so you can swap in your actual rates.
Assumptions (for 1 month)
- 1 real‑time endpoint (CPU) running 24×7
- 8M inferences/month
- One retrain (12 hours)
- 200 GB training/serving data in S3, 10 GB model artifacts, 50 GB EBS
- ~20 engineer hours for upkeep
Costs (for 1 month)
Compute costs
- Training compute (12 hrs) ……………………………… $420
- Endpoint hosting (24×7) ………………………………… $1,080
- Data transfer/invocations/processing …………… $60
Compute subtotal …………………………………………… $1,560
Storage costs
- S3 data (200 GB) ………………………………………………… $5
- S3 model artifacts (10 GB) ………………………………… $0.25
EBS volumes (50 GB) …………………………………………… $4
Storage subtotal ………………………………………………… $9.25 (~$10)
Maintenance (KTLO)
- Engineering time (20 hrs @ $100/hr) …………… $2,000
- Monitoring/alerts/logs (CloudWatch, etc.) …… $75
- On‑call/incident overhead ……………………………… $100
Maintenance subtotal ……………………………………… $2,175
Total monthly example: $3,745
We would track these three buckets separately and as a total. If compute cost or KTLO grows faster than impact, then we would pause and revisit model size, hosting tier, or retraining cadence to make this net profitable.
Make sure to read the previous article on ‘AI/ML Basics for Tech Leaders‘ to understand the AI/ML lifecycle.
Conclusion
The senior leaders who succeed with AI ask the right questions and make data driven decisions. AI/ML initiatives succeed when leaders measure what matters and hold them to the same standards as the rest of their technology. Use metrics as the common language to measure success 0f your programs. The TPM / Manager role is about driving clarity and prioritization. In AI/ML, that means making sure programs are evaluated on the same standards we use for any critical system: performance, reliability, and cost, all of which are tied back to the business.
Ready to rock your TPM Interview?
A detailed interview prep guide with tips and strategies to land your dream job at FAANG companies.
Author


