Last updated on October 5th, 2024 at 01:03 pm
More of a continuation from my previous post on Capacity Planning. The Application Resource Utilization primarily identifies the key factors that impact the response times and throughput of applications. As you tune your Application it is imperative to understand the primary factors that affect the performance of the API. In most cases, this can be attributed to one of the three below-described items.
- CPU Utilization
- Memory Utilization
- Disk I/O Utilization
CPU Utilization
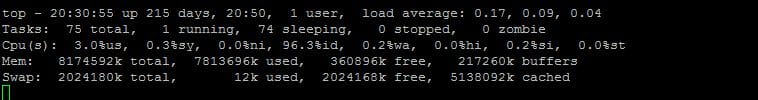
CPU Utilization is an integral part of the Application Resource utilization and is the percentage of time the processor spends doing work as opposed to being idle. CPU utilization normally measures The percentage of your CPU that is being used at that point in time by a process. The Top Command in Linux gives you all the values you need to measure the application Resource Utilization.
In multi-core systems, you can have percentages that are greater than 100%. For example, if 3 cores are at 60% use, the top will show a CPU use of 180%. You can toggle this behavior by hitting Shift while the top is running to show the overall percentage of available CPUs in use.
While performance testing it is important to know if there are any differences between your Load Environments vs your production environments. There can be considerable variance between Processor Families, Manufacturer, Resource sharing in the case of VMs or in terms of CPU Cores.
Resource – How to Measure Resource Utilization for a Project
Memory Utilization
Memory Utilization is part of the Application Resource Utilization and is measured as a % of physical memory utilized when the application is running. Memory shortage occurs due to the cause of instability and unresponsiveness in Java applications.
It is required to monitor the impact of garbage collection on response time and memory usage to ensure both stability and performance. The frequency of Garbage collection and memory leaks affects the stability and performance of the application. Although memory shortage is the main reason for increased GC activity it is important to understand the reason for the actual utilization of the memory.
IO wait
Disk I/O Utilization
Disk I/O is described as the amount & rate of reading/write disk activity. I/O Wait is the percentage of time your processors are waiting on the disk. As mentioned above the “Top” command in Linux gives you all the information you need. Let’s take an example where the API needs to query a database to return results and the Database query takes 800 ms this would mean that the processor is idle during the 800ms it is waiting for the response from the DB.
If your I/O wait percentage is greater than (1/Number of CPU cores) then your CPUs are waiting a significant amount of time for the disk subsystem to catch up. While optimizing for I/O you can look out for high-end VMs or Physical Machines that are optimized for Higher I/O.
While we carefully look at the Memory, Disk I/O, CPU while measuring the performance of the application under test. Writing tests that measure your application’s performance should take into consideration the below pointers-
- Number of API requests at Peak
- Duration of Peak utilization
- Number of API errors
- Time Spent in Database Query
Happy Testing of your Application Resource Utilization.
Recommended Reading: Data Center Virtualization Fundamentals. This is an excellent read. Something TPMs must-read.