
Last updated on July 24th, 2025 at 09:51 am
For Senior Tech Program Manager and Tech Leaders: Are you tired of yearly plans that quickly become irrelevant due to unforeseen challenges and shifting priorities? This blog challenges the traditional approach to annual planning, introducing the alternative Sequential Decision planning methods that reduce effort and increase impact, moving beyond the familiar cycle of meticulously crafted roadmaps.
In this blog post, we will delve into the power of implementing a Sequential Decision Analytics based Planning (SDA) process in tech projects — a paradigm shift from rigid, deterministic plans to more adaptable frameworks built around critical decision points. We’ve seen how traditional, overly specific plans often crumble in the face of inevitable uncertainty, leading to perceptions of inaccuracy and poor quality.
Stop the circus of planning madness – Most teams follow roadmaps without understanding goals. They barely deliver 50% of their promises, and the circus never stops – David Pereira author of Untrapping Product Teams
The Curse of Uncertainty in Tech Planning Approach
Tech projects face the pervasive “curse of uncertainty” and other inherent problems that often render our yearly plans obsolete. Tech leaders spend immense effort crafting detailed annual plans, yet unforeseen customer requirements shifts and rapid tech advancements often quickly derail them. The pressure for certainty pushes us into overly detailed, rigid plans ill-suited for dynamic environments. The solution is clear. We need a planning that is flexible, risk-aware, planned actions that embrace uncertainty, enables us to adapt quickly, and allows us to keep the focus on core business goals.
We’ll explore a powerful tool Sequential Decision Analytics (SDA) that significantly increases the effectiveness of the tech planning process handling for the uncertainties and provides a framework to quickly adapt to the unknown. Either you are doing an yearly or quarterly plan, SDA is designed to model, recognize and take actions for the inherent risks that plague technical programs.
SDA based planning process begins with identifying the key business deliverables and KPIs to achieve and then it works backwards. It creates critical decision points on the timeline to pivot to potential fallback options in case priorities change, while maximizing the ROI. The entire process helps estimate realistic financial results employing the probabilities and expected benefits. It ensures leadership is fully aware of the risks and expected quantitative benefits from the outset, that avoids the blame game, fostering a positive collaborative environment across the team.
Although SDA employs the decision trees, the trees must not be confused with the decision trees for predictive modeling.
Sequential Decision Analytics – Deep Dive with an Example
For the sake of illustration, let’s assume we are planning for next year. Business has requested a new tech product feature for next year. We have two primary options to plan for this feature in the upcoming year.
The first option is to continue this new feature development in the current ProductX. However, ProductX is built on legacy code, and we see a risk that further enhancements will lead to a complex architecture and escalating maintenance costs. Prioritizing continued development on the existing ProductX, with its inherent coding architecture limitations and significant technical debt, means we won’t be able to fully capitalize on the potential benefit of the new feature, limiting its yield to $6.0MM. Furthermore, continued development on ProductX will make it increasingly rigid and unable to accommodate future features, likely hitting a development wall within 2–3 years.
The second option is to pivot entirely and initiate the development of a more advanced product, ProductY, intended to eventually replace ProductX. Because ProductY will possess the inherent capability to readily incorporate new features demanded by the business, based on modern code and a re-engineered logic, it potentially yields a global optimal solution leading to a savings of $10.00M. The natural inclination for a manager might be to immediately prioritize the development of ProductY over ProductX.
However, as responsible project managers, before we rush into picking ProductY just because it could be amazing, let’s take a step back. We need to look at this situation with our “uncertainty glasses” on - what could go wrong? Good risk management starts by asking our team: “What are the possible problems here, and what can we do about them?” The key idea is to stop thinking of the project as just a list of features to be delivered by certain dates. Instead, we should identify the big choices we’ll have to make and their impact on the business KPI. Experts refer to this as “sequential decision analysis,” but it’s essentially about thinking ahead in a structured manner. It forces us to consider how likely it is that things will succeed or fail before we even begin.
Stop thinking of the project as just a list of features to be delivered by certain dates. Instead, we should identify the big choices we’ll have to make and its impact on the business KPI
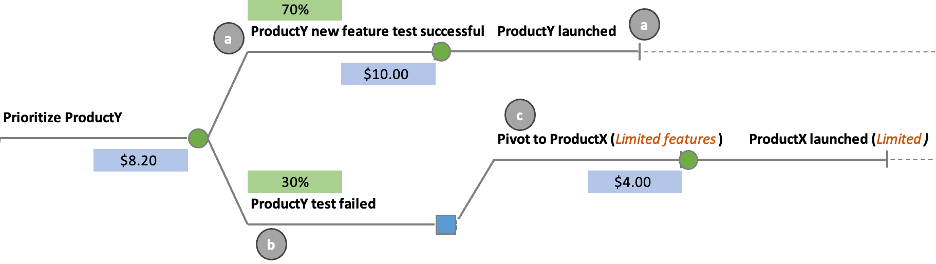
So, after thinking about the risks, our team came back with this: The big worry with ProductY is its brand new “brain” - that new algorithm. We need to test it in various ways to ensure it’s as good as, or better than, what ProductX has. They figure there’s a 70% chance this new algorithm will work. But, there’s also a 30% chance it won’t pass the tests. If it fails, we could end up in a bad spot where we don’t even get the new feature at all, in either ProductX or ProductY. That would mean we would completely miss what the business wanted, with a 30% chance of that happening.
The real power of Sequential Decision Analysis (SDA) is that by encouraging the team to think about risks upfront, we uncovered a potential breaking point: the tests for ProductY could fail, completely derailing our plans. This highlights a common leadership challenge. Often, we enthusiastically push new ideas and products, and our teams, eager to please, mirror that excitement. Positivity fills the air, and we tend to overlook the possibility of failure, often neglecting to plan for such scenarios. If someone does voice concerns, they might be met with reassurances of “positive vibes” or a vague “we have a Plan B.” But when failure actually strikes, we’re left scrambling for Plan B and Plan C, navigating a flurry of calls, explanations, and even blame. As Technical Program Managers, we shift from managing the actual work to managing the management of the work and generating countless unplanned documents to explain the situation.
Returning to our example, now that we’ve identified a potential failure point with ProductY, we can proactively seek mitigation plans. We encouraged the team to explore our options if the ProductY tests fail. They proposed this: if ProductY doesn’t pass its tests, we can immediately shift all our resources to developing the new feature within the existing ProductX. However, because of ProductX’s limitations, we’d likely only achieve a reduced benefit, perhaps around $4.00MM. Importantly, the team also suggested we strategically time the ProductY development and testing so that if it fails, we still have enough time to develop the feature in ProductX.
This entire potential future, with its choices and possible outcomes, can be clearly visualized using a decision tree diagram. For automated calculations and generating this diagram, I’ve utilized the BYTree Plan Excel-based tool. This macro-enabled worksheet is available for download at this Github Repository. You can find a simple tutorial on how to use the tool at this YouTube link.
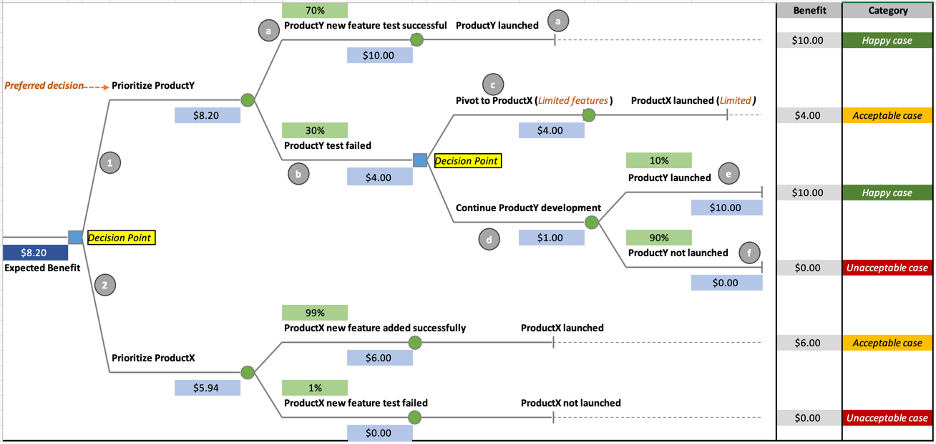
Don’t let the decision tree diagram intimidate you! If we just focus on the main choices, the likely outcomes, and how probable they are (the tool handles all the math behind the scenes), it becomes quite straightforward. Think of Branch 1 and Branch 2 as our initial big decisions for the year.
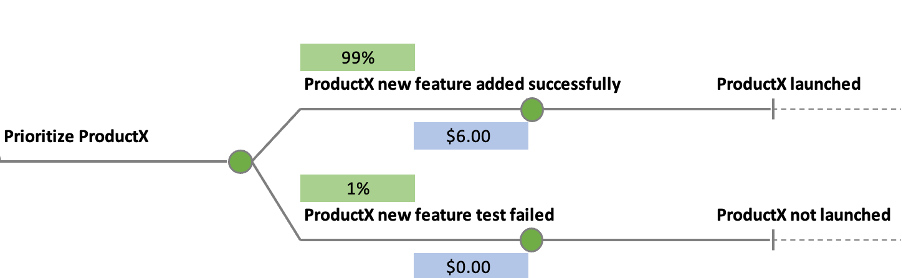
- Branch 1: Develop ProductY.
- Branch 2: Add the new feature to the existing ProductX.
Even though Branch 2 (improving ProductX) looks like a safe bet with a high (99%) chance of success, the potential reward is low — only $6.00M. There’s also a tiny 1% chance of complete failure, meaning the overall expected value from this path is $5.94M. Plus, remember ProductX is already struggling with its old technology.
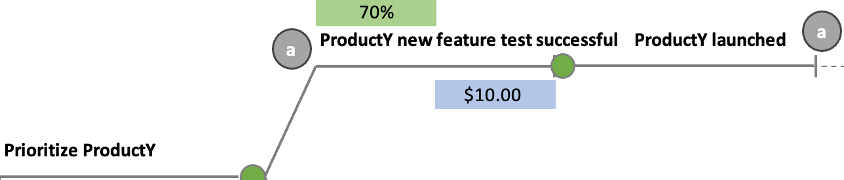
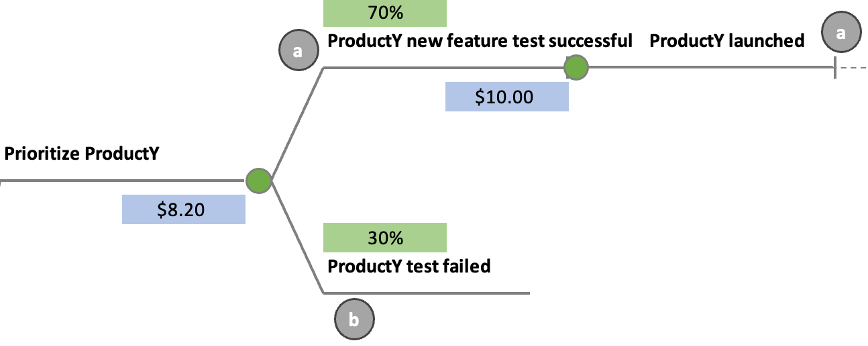
That’s why Branch 1 (building ProductY) is more appealing, even with its risks. Let’s zoom in on that:
1. Branch 1-a (70% chance): Success! If the new technology in ProductY works out (70% likely), we hit the jackpot with a $10.00MM benefit.
2. Branch 1-b (30% chance): Failure. If the new technology doesn’t pass the tests (30% likely), we reach a new decision point
– Branch 1-b-c: Pivot to ProductX. We stop working on ProductY and pour all our efforts into adding the new feature to the existing ProductX. We’ll get a smaller benefit of $4.00MM, but at least we deliver something.
– Branch 1-b-d: Keep going with ProductY. We ignore the failed tests and try to make ProductY work anyway. The team thinks there’s only a small (10%) chance of success here, still giving us $10.00MM, but a very high (90%) chance of complete failure (zero benefit). The overall expected benefit from this path is a low $1.0MM.
Comparing our options if ProductY fails, pivoting to ProductX (Branch 1-b-c) with a $4.00MM expected benefit is clearly better than stubbornly sticking with a likely failing ProductY (Branch 1-b-d) with only a $1.0MM expected benefit.
When we weigh all the possibilities, the overall expected value of choosing to develop ProductY (taking into account both the success and the best course of action if it fails) is $8.20M. This makes it the more strategic choice despite the initial uncertainty.
So, what’s the final plan for next year based on SDA framework? the final plan for next year prioritizes the development of ProductY. However, crucially, we’ve identified a significant 30% risk of failure associated with ProductY’s new technology. To address this, our plan includes a mandatory and early test plan for ProductY. This testing phase must be strategically timed to allow sufficient lead time to pivot resources back to developing the feature in ProductX should the ProductY tests fail. This proactive approach ensures we have a viable fallback option and don’t completely miss the business objective. Finally, the approach also suggested to commit the lower expected benefit to the leadership (dial down from $10.0M to $8.20M), which seems reasonable given the uncertainty.
Summary
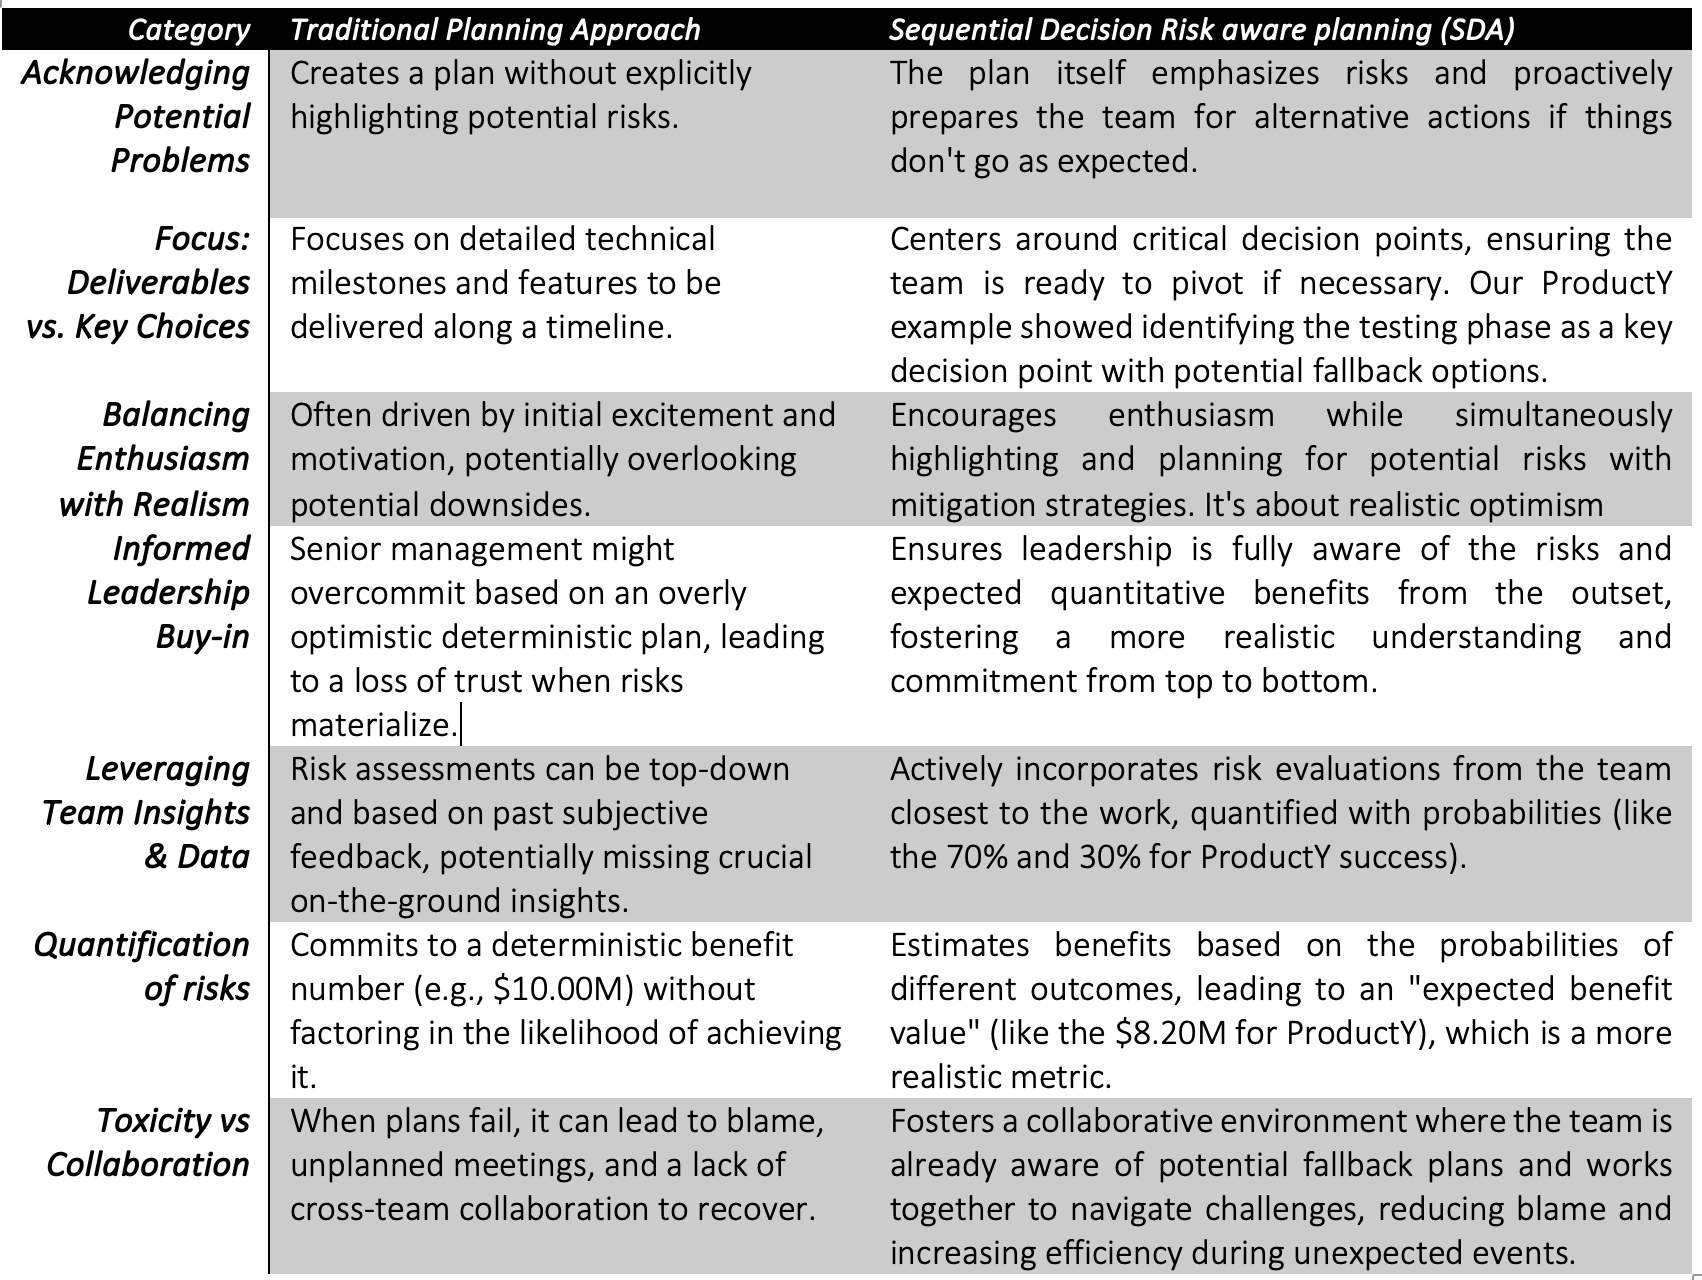
Here’s a table summarizing the key differences between the SDA approach we just illustrated and a more traditional planning approach:
Closing Remark
Simply making teams conscious of potential pitfalls can foster remarkable resilience, empowering them to proactively develop alternative actions. This framework naturally cultivates a more positive and collaborative environment, replacing blame with shared preparedness. We also emphasized the importance of tempering leadership enthusiasm with balanced scenario planning, preventing overcommitments and fostering realistic expectations. Crucially, we introduced a quantitative approach using the principles of sequential decision analysis, enabling us to provide more reliable benefit projections to finance.
By now, you might be thinking, “Wait, isn’t this just formalizing what I already do in my head?” And the answer is, yes, but in essence. SDA brings that innate human ability to anticipate and plan onto paper, providing structure, scalability, and a platform for team collaboration. It moves beyond individual mental models to a shared, actionable framework, mitigating the chaos and blame that often follow unexpected setbacks.
Your next thought might be about the upfront effort of risk analysis. However, consider this against the reactive scramble and organizational stress that occur when plans derail. The proactive approach is often a far more efficient investment. And the good news? In the second part of this blog series, I will introduce an automated framework designed to streamline this entire planning process from end to end, significantly reducing the workload and making robust, uncertainty-aware planning a practical reality. Stay tuned!
References:
I have focused on the implementation of the SDA in this blog, specifically in program management. I have not presented the mathematical calculation that ran behind the scene e.g., probability, or expected benefits calculations. I wanted to ensure the blog doesn’t become too lengthy and doesn’t distract from the objective. Nevertheless, for those interested in mathematical formulations, please refer to the references provided below.
- Understand the calculation behind the Decision Tree: Refer Peyman Kor Decision Risk Analysis Medium Blog
- BYTree plan Github Repository
- Tutorial on BYTree YouTube link
Disclaimer: Opinions written here are strictly my own. I’m not representing my current employer.
Ready to level up your TPM Career?
Unlock your potential as a TPM—master the fundamentals, navigate career levels, and excel in your role.
Author

Zishan Yusuf
Sr. Technical Program Manager
Zishan Yusuf is a Senior Technical Program Manager with 13 years of experience in Amazon, based out of Luxembourg, managing Optimization and ML based Al tech products and projects.


Great writeup! I like how structured thinking formalized on paper can make the various execution paths very clear and provide a realistic picture. One tiny nitpick: it’s not too clear how the $8.20MM figure is calculated, so it should probably be incorporated in the diagram.